Statistical Programming: Problem Set 1
Notes
Exercises
This is a very extensive problem set to give you ample opportunity to practice programming in Python. For the tutorials, please try to solve the following Exercises
- Section 1
- Exercise 1 a., b. and d.
- Exercise 3 a.
- Exercise 4 a. and c.
- Exercise 5
- Section 2
- Exercise 1 a., b., c., f.
- Exercise 2
- Section 3
- Exercise 1, b.
- Exercise 2
- Section 4
- Exercise 1, b.
- Section 5
- Exercise 1
General Note
You will very likely find the solution to these exercises online. I, however, strongly encourage you to work on these exercises without doing so. Understanding someone else’s solution is very different from coming up with your own. Use the lecture notes and try to solve the exercises independently.
Traditionally, the first program you write in a new language is called “Hello World!”. Use the print() statement to display “Hello World!” on the screen.
- Hint:
help(print)
Section 1: Values and data types
Exercise 1: User Input and Strings
- Write a Python program that accepts the user’s first and last name and prints them in reverse order with a space between them.
- Hint: Use f-strings. (Note:
input()is not available in browser-based Python, so define your variables directly.)
Solution:
full_name_reverse = f"{last_name} {first_name}"
print(full_name_reverse)

# Alternative solution using concatenation:
# full_name_reverse = last_name + " " + first_name

# Alternative solution using print directly:
# print(last_name, first_name)
Write a program that accepts a string from the user and …
… only shows the first three letters,
… only shows the last three letters,
… takes the 2nd letter and repeats it 4 times,
… shows the length of the string,
… shows whether the string contains another user-provided substring, for example
"a",… shows the very first occurence of the substring
"a",… shows the very first occurence of the substring
"a"excluding the first and the last letter.
Define two strings ‘string1’ and ‘string2’ and describe what happens…,
… if you compare them with
==,>and<,… if you test them with
inandnot,
Write a program that takes a string as a user input and only returns…
…. the letters that are present at an even index, e.g., the input “test run” would result in displaying “t”, “s”, and “u”, (Hint:
range())… the letters that are vowels.
Part 1: Even indices
Hint: Use range(0, len(string_input)) to iterate through all indices, and check if i % 2 == 0 to determine if an index is even.
Solution:
string_input = "Hello World"
for i in range(0, len(string_input)):
    if i % 2 == 0:
        print(string_input[i])

# Alternative solution using slicing:
print(string_input[::2])
Part 2: Vowels
Hint: Use for letter in string_input: to iterate through each character. Check if letter.lower() in vowels to handle both uppercase and lowercase vowels.
Solution:
string_input = "Hello World"
vowels = ["a", "e", "i", "o", "u"]

for letter in string_input:
    if letter.lower() in vowels:
        print(letter)
Exercise 2: User Input and Integers
Accept two integer values from the user and return their product. If the product is greater than 1000, then return their sum. (Note: input() is not available in browser-based Python, so define your variables directly.)
- Hint:
isnumeric().
Hint: The .isnumeric() method returns True if a string contains only numeric characters. Remember that 42 * 25 = 1050, which is greater than 1000, so you should return the sum (67) instead of the product.
Solution:
n1 = "42"
n2 = "25"

if n1.isnumeric() == False or n2.isnumeric() == False:
    print("Input must be integer numbers!")
else:
    n1 = int(n1)
    n2 = int(n2)
    if n1 * n2 > 1000:
        print(n1 + n2)  # Sum: 67
    else:
        print(n1 * n2)  # Product
Demo: Checking if a string is numeric
Exercise 3: Tuples, Lists and Dictionaries
Consider the screenhot in Figure 1 taken from wikipedia.org.
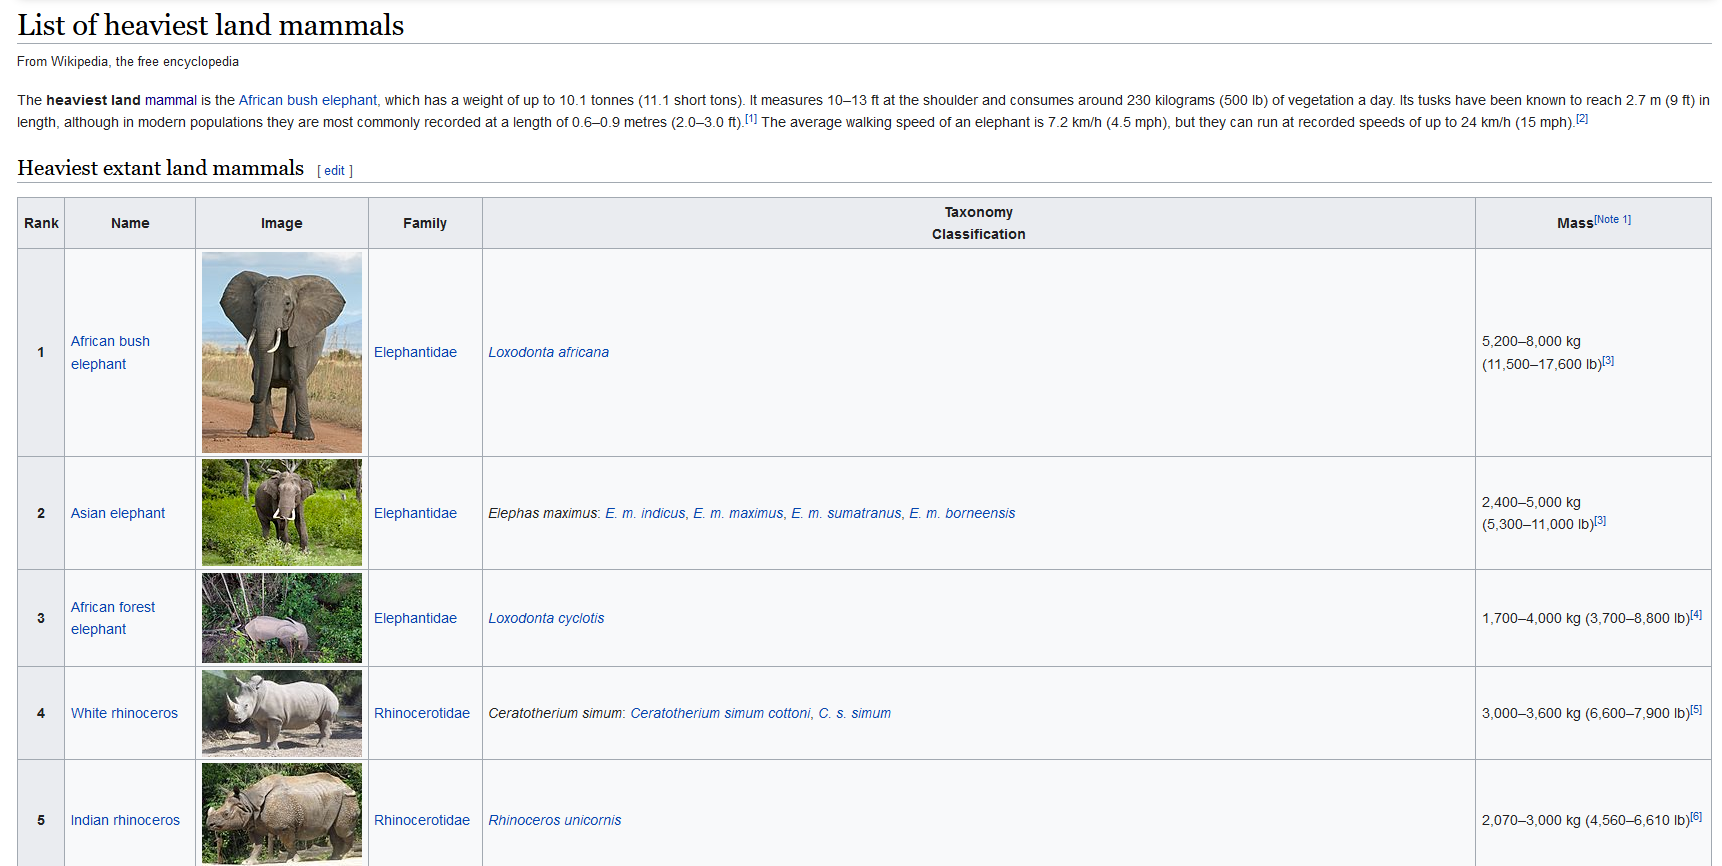
Which Python data types could you use in principle to collect …
… the names of the five heaviest mammals? Implement it in every possible data type. Write a program that outputs the first, the second and the fifth of the heaviest mammals.
… the names and the (maximum) mass of the mammals? Again, implement it in every possible data type and write a program that outputs the name and the maximum mass of the first, the second and the fifth heaviest mammal
Part 1: Storing just the names
Hint: - Tuple: Use parentheses ("item1", "item2", ...) - List: Use square brackets ["item1", "item2", ...] - Dictionary: You already have the structure, just fill in the list for the ‘names’ key
To access elements, use indexing: mammals_names1[0] for the first element (remember: 0-based indexing!)
Solution:
mammals_names1 = ("African bush elephant", "Asian elephant", "African forest elephant", "White rhinoceros", "Indian rhinoceros")

mammals_names2 = ["African bush elephant", "Asian elephant", "African forest elephant", "White rhinoceros", "Indian rhinoceros"]

mammals_names3 = {'names': ["African bush elephant", "Asian elephant", "African forest elephant", "White rhinoceros", "Indian rhinoceros"]}

# Accessing elements (indices 0, 1, 4 for 1st, 2nd, 5th)
print(mammals_names1[0])
print(mammals_names1[1])
print(mammals_names1[4])

# Using a loop
for i in [0, 1, 4]:
    print(mammals_names2[i])

# Dictionary access
print(mammals_names3['names'][0])- Based on Part a), consider the following problems. Discuss/show whether and how you could solve them with the different data type implementations.
Consider the names of the heaviest mammals only. A researcher wants to sort the names of the heaviest animals according to their alphabetical order. Create a new list called
mammals_names_sorted. What happens do the original list of names, if you use Python’s.sort()method for lists?A new study reports the observation of a new species called “Giant Australian hamster” with a mass of 5000 kg. Insert this observation in your list. Hint: Use Python’s
.insert()method for lists.Now, consider the list of the mammals’ name and mass. A new study reports that an African bush elephant with a mass of 10000 kg has been observed. Update the list of heaviest mammals in the solutions from Part a) (if possible).
Exercise 4: Lists
- Given a list of integers (which you define in your code), output
"True"if the first and last number of the list are the same (else output"False").
Hint: Use negative indexing to access the last element: list1[-1]. Compare it with the first element using list1[0] == list1[-1].
Solution:
list1 = [1, 23, 4, 123, 2, 3, 5, 6, 2]
if list1[0] == list1[-1]:
    print("True")
else:
print("False")- Given a list of numbers (which you define in your code), print only those numbers that can be divided by 5 without residual.
- Write a program that combines two lists by alternatingly taking elements, e.g.
["a","b","c"], [1,2,3] -> ["a",1,"b",2,"c",3]
Hint: Use range(0, len(list5)) to iterate through indices. Inside the loop, append list4[i] first, then append list5[i].
Solution:
list4 = ['a', 'b', 'c']
list5 = [1, 2, 3]
list6 = []

for i in range(0, len(list5)):
    list6.append(list4[i])
    list6.append(list5[i])

print(list6) # Output: ['a', 1, 'b', 2, 'c', 3]- Let a small data set be \[5\ 2\ 11\ 19\ 6.\]
- Enter these numbers into a list
x_list. - Find the square of each number and enter these numbers into a list
x_square.
Exercise 5: Functions
- Write a function
comparethat returns the value- 1 if \(x>y\),
- 0 if \(x=y\) and
- -1 if \(x<y\).
Solution:
def compare(x, y):
    if x > y:
        return 1
    elif x == y:
        return 0
    else:
        return -1

compare(2, 3)  # Returns -1
Example: Counting letters
The following program counts the number of times the letter “a” appears in a string:
- Encapsulate the code above in a function named
count(w, l, s)that counts the number of times a letterlappears in a wordw. Additionally,sgives the index inwwhere it should start the search.
Hint: Use w[s:len(w)] or w[s:] to get the substring starting from index s. Then loop through this substring to count occurrences of letter l.
Solution:
def count(w, l, s):
    count = 0
    for letter in w[s:len(w)]:
        if letter == l:
            count = count + 1
    return count

# Example
count('hello', 'l', 0) # Returns 2- Generate a random integer between 1 and 10. Write a guessing game where the user has to guess the secret number. After every guess, the program tells the user whether their number was too large or too small. At the end the number of tries needed should be printed. (Note:
input()is not available in browser-based Python. Below is a simulated version of the guessing game.)
- Hint: Use the function
randint()provided in therandommodule to randomly draw integers.
Example: Random number generation
Simulated guessing game:
Section 2: Files, Modules and Classes
Exercise 1: Object Orientation
Mike and Jenny both have a car. Mike’s car is a Opel Manta, Jenny drives a Cadillac Escalade. Both collected data on their fuel stops in the last month.
- Mike’s record:
| Mileage1 | Amount of Gasoline |
|---|---|
| 1200 | |
| 2000 | 70 |
| 2250 | 22 |
- Jenny’s record:
| Mileage | Amount of Gasoline |
|---|---|
| 8200 | |
| 9400 | 80 |
| 10400 | 68 |
| 12000 | 110 |
- Define a new object class
Carwhich represents a car in terms of the owner’s name (attributeowner), the model of the car (model), the mileage (kilometers) and amount of gasoline (gas) at the recorded fuel stops. Generate two new instances for Mike’s and Jenny’s car, assign attributes and access them using pythons’s dot notation.
Solution:
class Car:
    """Represents a car in terms of its owner, model, mileage and amount of
    gasoline at several fuel stops.

    attributes: owner, model, kilometers, gas
    """

    def __init__(self, owner, model, kilometers, gas):
        """Create a new instance of a car."""
        self.owner = owner
        self.model = model
        self.kilometers = kilometers
        self.gas = gas

# Create instances
MikesCar = Car("Mike", "Opel Manta", [1200, 2000, 2250], [70, 22])
JennysCar = Car("Jenny", "Cadillac Escalade", [8200, 9400, 10400, 12000], [80, 68, 110])

# Access attributes
MikesCar.owner    # 'Mike'
MikesCar.model # 'Opel Manta'- Implement a method
print_car()that describes the object in a message saying something like:"This is Mike's car. It is a Opel Manta.".
Hint: Use an f-string to format the message: print(f"This is {self.owner}'s car. It is a {self.model}.")
Solution:
class Car:
    def __init__(self, owner, model, kilometers, gas):
        self.owner = owner
        self.model = model
        self.kilometers = kilometers
        self.gas = gas

    def print_car(self):
        """Prints a description of a car."""
        print(f"This is {self.owner}'s car. It is a {self.model}.")

# Note: It's common to use __str__ for string representation:
# def __str__(self):
# return f"This is {self.owner}'s car. It is a {self.model}."- Add a method
avg_consumption()that returns the average consumption (in liter per 100 kilometers) between the recorded fuel stops.
Hint: Loop through indices with for i in range(len(self.gas)). Calculate consumption as: self.gas[i] / (self.kilometers[i+1] - self.kilometers[i]) * 100
Solution:
class Car:
    def __init__(self, owner, model, kilometers, gas):
        self.owner = owner
        self.model = model
        self.kilometers = kilometers
        self.gas = gas

    def print_car(self):
        print(f"This is {self.owner}'s car. It is a {self.model}.")

    def avg_consumption(self):
        """Calculates the average fuel consumption (l/100km)."""
        avg_l_per_km = []
        for i in range(len(self.gas)):
            this_l_per_km = self.gas[i] / (self.kilometers[i+1] - self.kilometers[i]) * 100
            avg_l_per_km.append(this_l_per_km)
        return avg_l_per_km

# Test
MikesCar = Car("Mike", "Opel Manta", [1200, 2000, 2250], [70, 22])
print(MikesCar.avg_consumption()) # [8.75, 8.8]- Implement a new method
add_stop()that allows to add data from a new fuel stop, i.e., enter a new entry forkilometersandgas. Add a new fuel stop and check if it is successfully listed in the output of theavg_consumption()call.
- Generate a new class
Carpool(without any functionality) in which you encapsulate Mike’s and Jenny’s cars. Add a new stop to Mike’s record and see if the encapsulated object has changed. Explain why (not) and provide an example how you can avoid that your change is effective for the encapsulated object.
- Hint: Use
import copyto use the calldeepcopyfor generating a deep copy of a list.
- Consider the following objects and do the tasks below.
Setup: Create the Car class and car instances
Task 1: Sort cars by maximum mileage (descending)
Hint: Use sorted(car_list, key=lambda car: max(car.kilometers), reverse=True) to sort by maximum mileage in descending order.
Solution:
sorted_cars = sorted(car_list, key=lambda car: max(car.kilometers), reverse=True)

for car in sorted_cars:
    print(f"{car.owner}: {max(car.kilometers)} km")
# Output: Bob (200300), Carl (183998), Jenny (12000), Mike (2250)
Task 2: Filter cars by average consumption
Solution:
low_consumption = []
high_consumption = []

for car in car_list:
    avg = car.avg_consumption()
    if avg < 10:
        low_consumption.append(car)
    else:
        high_consumption.append(car)

# Alternative using list comprehension:
# low_consumption = [car for car in car_list if car.avg_consumption() < 10]
# high_consumption = [car for car in car_list if car.avg_consumption() >= 10]
Task 3: Filter objects by type
Hint: Use isinstance(item, Car) to check if an item is an instance of the Car class.
Solution:
cars_only = []
for item in mixed_list:
    if isinstance(item, Car):
        cars_only.append(item)

# Alternative using list comprehension:
# cars_only = [item for item in mixed_list if isinstance(item, Car)]

print([car.owner for car in cars_only])  # ['Mike', 'Bob']
Exercise 2: Basic Calculations with the math module
Import the math module:
Use Python as a calculator to find the numeric answers for the following expressions:
- \(1+2(3+4)\)
- \(4^3+3^{2+1}\)
- \(\frac{1+2}{3+4}\)
- \(\sqrt{(4+3)(2+1)}\)
- \(\sin(\pi)+\cos(\pi)\)
- \(\exp(0) \times \log(2)\)
Hints: - Use ** for exponentiation (e.g., 4**3 for \(4^3\)) - For square root, use math.sqrt() - For π, use math.pi - For sin and cos, use math.sin() and math.cos() - For exponential, use math.exp(), for natural log use math.log()
Solution:
import math

result1 = 1 + 2*(3+4)              # 15
result2 = 4**3 + 3**(2+1)          # 91
result3 = (1+2)/(3+4)              # 0.4286
result4 = math.sqrt((4+3)*(2+1))  # 4.5826
result5 = math.sin(math.pi) + math.cos(math.pi)  # -1.0 (approximately)
result6 = math.exp(0) * math.log(2)  # 0.6931
Section 3: NumPy
Exercise 1: Working with NumPy Arrays
- You recorded your car’s mileage at your last six fill-ups as
\[ 34332\ 34604\ 34828\ 35019\ 35273\ 35513\]
- Enter these numbers into the array
m_age. Calculate the amount of miles that was driven after each fill up and enter these numbers into the variable miles. How many values does this variable include? What is the average amount of miles?- Hint:
np.diff()
- Hint:
- Your cell-phone bill varied the last year from month to month the following way:
\[ 22\ 31\ 18\ 35\ 29 \ 32\ 19\ 23\ 23\ 25\ 20\ 33\]
- What is the largest amount you spent in a month? What is the smallest?
- Find the total amount and the average amount per month that you spent in the last year!
- How many months was the amount greater than $30?
- Is it worth to enter into a flatrate ($25 per month) for the next year expecting on average the same bills?
Hints: - Use np.max(bill) for maximum, np.min(bill) for minimum - Use np.sum(bill) for total, np.mean(bill) for average - bill > 30 creates a boolean array; np.sum(bill > 30) counts True values - Flatrate cost is 25 * 12 = 300 per year
Solution:
import numpy as np

bill = np.array([22, 31, 18, 35, 29, 32, 19, 23, 23, 25, 20, 33])

max_bill = np.max(bill)          # 35
min_bill = np.min(bill)          # 18
total_bill = np.sum(bill)        # 310
avg_bill = np.mean(bill)         # 25.83

months_over_30 = np.sum(bill > 30)  # 3 months
savings_with_flatrate = np.sum(bill) - 25*12  # 310 - 300 = 10

# Yes, the flatrate would save $10 per year
Exercise 2: Linear Regression with NumPy
The linear regression (see lecture 2) is a basic concept in statistics. Consider the linear regression model: \[ y_i = \beta_0 + \beta_1X_i + \varepsilon_i = \mathbf{X}_i^T \boldsymbol{\beta} + \varepsilon_i \]
One can estimate the coefficients \(\mathbf{\hat{\beta}}\) by solving the following matrix equation: \[ \boldsymbol{\hat{\beta}}=(\mathbf{X}^T\mathbf{X})^{-1}\mathbf{X}^T\mathbf{y} \]
Calculate \(\boldsymbol{\hat{\beta}}\) and the residuals \(\boldsymbol{\varepsilon} = \mathbf{y} - \mathbf{\hat{y}}\) using NumPy for the following small dataset.
| Shoe Size (\(X\)) | Height (\(y\)) |
|---|---|
| 36 | 170 |
| 37 | 175 |
| 38 | 180 |
| 38 | 169 |
| 40 | 190 |
- Hint: To have an intercept \(\hat{\beta}_0\) in the model, add a full column of \(1\)s to your independent variable \(X\) to get your design matrix \(\mathbf{X}\) with
np.ones().
Hints: - Design matrix: X = np.vstack((np.ones(shape=x_1.shape), x_1)).T - Formula: beta_hat = (X^T X)^(-1) X^T y - Use np.matmul(A, B) or A @ B for matrix multiplication - Use np.linalg.inv(A) for matrix inverse
Solution:
import numpy as np

x_1 = np.array([36, 37, 38, 38, 40])
y = np.array([170, 175, 180, 169, 190])

# Create design matrix (add column of ones for intercept)
X = np.vstack((np.ones(shape=x_1.shape), x_1)).T

# Calculate beta_hat = (X^T X)^(-1) X^T y
beta_hat = np.matmul(np.matmul(np.linalg.inv(np.matmul(X.T, X)), X.T), y)

# Calculate predicted values
y_hat = np.matmul(X, beta_hat)

# Calculate residuals
residuals = np.subtract(y, y_hat)

print(f"Intercept: {beta_hat[0]:.2f}")  # 76.25
print(f"Slope: {beta_hat[1]:.2f}")      # 2.69
print(f"Residuals: {residuals}")

# Interpretation: For each cm increase in shoe size, height increases by ~2.69 cm
Section 4: Pandas
Exercise 1: Pandas DataFrames
- M and M’s Example
A bag of the candy M and M’s has many different colors. The table in Figure 2 contains the targeted color distribution in a bag of M and M’s as percentages for various types of packaging.
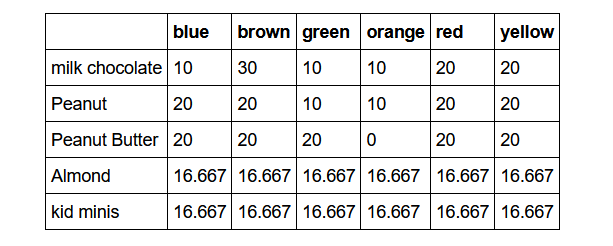
Enter this table into a pandas.DataFrame called mandms. Use pandas to answer the following questions:
Which packaging is missing one of the six colours?
Confirm that the color shares sum up to 100% for each package type.
- Hint:
DataFrame.sum()
- Hint:
Write a code that displays the colour that is most frequent!
- Hint:
DataFrame.sum()
- Hint:
- Brain size data set
The brain_size.csv data set is pre-loaded and available at data/brain_size.csv. The dataset contains a small sample of observations of features (like gender, weight, height and three different IQ-measures) for different individuals.
Load and explore the data:
Before we perform analysis, we’ll do some preprocessing and calculate descriptive statistics.
Hints: - Drop column: brain_size.drop(['Unnamed: 0'], axis=1, inplace=True) - Remove NaN: brain_size.dropna(inplace=True) - Median: brain_size['Weight'].median() - Count values: np.sum(brain_size["Gender"] == "Female") - Group by: brain_size.groupby('Gender').mean()
Solution:
import pandas as pd
import numpy as np

brain_size = pd.read_csv(r"https://raw.githubusercontent.com/JanTeichertKluge/data-statprog/refs/heads/main/data/brain_size.csv", sep=';', na_values=".")

# Drop unnecessary column
brain_size.drop(['Unnamed: 0'], axis=1, inplace=True)

# Remove NaN values
print(brain_size.shape)  # Before: (40, 8)
brain_size.dropna(inplace=True)
print(brain_size.shape)  # After: (38, 7)

# Calculate statistics
print(brain_size['VIQ'].mean())     # ~112.35
print(brain_size['VIQ'].std())      # ~15.18
print(brain_size['Weight'].median())  # 67.5

# Gender analysis
num_women = np.sum(brain_size["Gender"] == "Female")  # 16
num_men = np.sum(brain_size["Gender"] == "Male")      # 22
pct_women = (num_women / len(brain_size)) * 100      # 42.1%

# Means by gender
means_by_gender = brain_size.groupby('Gender').mean()
print(means_by_gender[['VIQ', 'Weight', 'Height']])
Section 5: Data Visualization
Exercise 1: Basic visualization with matplotlib
In this exercise, we will visualize cosine and sine functions using matplotlib. We’ll create line plots with proper labels and styling.
Hints: - Generate x: x = np.linspace(0, 2*np.pi, 100) - Cosine: y_cos = np.cos(x) - Sine: y_sin = np.sin(x) - Plot: plt.plot(x, y_cos, label='Cosine') - Dashed line: Use linestyle='--' or linestyle='dashed' - Legend: plt.legend() - Show: plt.show()
Solution:
import numpy as np
import matplotlib.pyplot as plt

# Generate x values from 0 to 2π
x = np.linspace(0, 2*np.pi, 100)

# Calculate cosine and sine
y_cos = np.cos(x)
y_sin = np.sin(x)

# Create line plot with both functions
plt.plot(x, y_cos, label='Cosine', color='blue')
plt.plot(x, y_sin, label='Sine', linestyle='--', color='red')

# Add labels and title
plt.xlabel('x')
plt.ylabel('y')
plt.title('Cosine and Sine Functions')

# Add legend
plt.legend()

# Display plot
plt.show()
Additional examples (demonstrating other matplotlib features):
Scatter plot:
Multiple subplots:
Exercise 2: Times University Ranking Data
Load the Times University Ranking Data, which collects data on a ranking of international universities. The data file timesData.csv is pre-loaded and available at data/timesData.csv.
Open the data set with
pandasand have a look at the very first rows. What do you see?What has been the best university from Germany in 2016? What is its rank?
How has the university’s ranking changed over time? Create a scatter plot that shows the development of the university’s ranking over time.
Create a graphic that shows the changes in terms of the variables
international,research,citation,incomeandtotal_scorefor this university over time.Modify the graphics in a way you like. Try using
matplotlibto create your own visualization based on the Times Data set.
Footnotes
Mileage denotes the total number of kilometers driven with a car. The first value is the number of kilometers at the last fuel stop before record.↩︎