This is the solution file for Problem Set 2. It covers data loading, exploration, cleaning, joining, filtering, grouping, and visualization using the Times Higher Education World University Rankings and a continents mapping dataset.
Section 1: Loading Data
Exercise 1: Load the Datasets
import pandas as pdimport numpy as npimport matplotlib.pyplot as pltimport seaborn as snsurl_times ="https://raw.githubusercontent.com/JanTeichertKluge/data-statprog/refs/heads/main/data/timesData.csv"url_continents ="https://raw.githubusercontent.com/JanTeichertKluge/data-statprog/refs/heads/main/data/continents.csv"df_times = pd.read_csv(url_times)df_continents = pd.read_csv(url_continents)print("Times Data shape:", df_times.shape)print("Continents Data shape:", df_continents.shape)
Times Data shape: (2603, 14)
Continents Data shape: (285, 3)
# Replace '-' with NaN across the whole DataFramedf_times = df_times.replace('-', np.nan)# Verifyremaining = (df_times['total_score'] =='-').sum()print(f"Remaining '-' in total_score: {remaining}")print(f"Sample values: {df_times['total_score'].dropna().head().tolist()}")
                               university_name       country  num_students
2413                        Anadolu University        Turkey      379231.0
2430                          Cairo University         Egypt      231941.0
2562                University of South Africa  South Africa      197102.0
2259  National Autonomous University of Mexico        Mexico      137378.0
2408                     Alexandria University         Egypt      127431.0
# Inspectprint(df_continents.head())# Rename columnsdf_continents = df_continents.rename(columns={'Entity': 'country','Countries Continents': 'continent'})# Keep only necessary columns (drop the Year column if present)df_continents = df_continents[['country', 'continent']].drop_duplicates()# Left mergedf_merged = pd.merge(df_times, df_continents, on='country', how='left')print(f"\nMerged shape: {df_merged.shape}")print(df_merged[['university_name', 'country', 'continent']].head())
                  Entity  Year Countries Continents
0               Abkhazia  2015                 Asia
1            Afghanistan  2015                 Asia
2  Akrotiri and Dhekelia  2015                 Asia
3                Albania  2015               Europe
4                Algeria  2015               Africa

Merged shape: (2603, 17)
                         university_name                   country continent
0                     Harvard University  United States of America       NaN
1     California Institute of Technology  United States of America       NaN
2  Massachusetts Institute of Technology  United States of America       NaN
3                    Stanford University  United States of America       NaN
4                   Princeton University  United States of America       NaN
Exercise 9: Handle Mismatched Country Names
# a) Countries with missing continentsmissing = df_merged[df_merged['continent'].isna()]['country'].unique()print("Countries with missing continent:", missing)# b) Fix country names in df_times and re-mergedf_times['country'] = df_times['country'].replace({'United States of America': 'United States','Russian Federation': 'Russia','Republic of Ireland': 'Ireland',})df_merged = pd.merge(df_times, df_continents, on='country', how='left')# c) Check remainingstill_missing = df_merged[df_merged['continent'].isna()]['country'].unique()print(f"\nCountries still missing a continent: {still_missing}")print(f"Rows without continent: {df_merged['continent'].isna().sum()}")
Countries with missing continent: ['United States of America' 'Republic of Ireland' 'Russian Federation'
 'Czech Republic' 'Macau' 'Unisted States of America' 'Unted Kingdom']

Countries still missing a continent: ['Czech Republic' 'Macau' 'Unisted States of America' 'Unted Kingdom']
Rows without continent: 17
Section 5: Filtering & Selection
Exercise 10: Filter the Data
# a) Clean world_rank and filterdf_merged['world_rank_num'] = pd.to_numeric( df_merged['world_rank'].str.replace('=', '', regex=False), errors='coerce')top_10_2016 = df_merged[ (df_merged['year'] ==2016) & (df_merged['world_rank_num'] >=1) & (df_merged['world_rank_num'] <=10)]# b) Displayprint(top_10_2016[['world_rank', 'university_name', 'country', 'continent']].to_string(index=False))# c) Count Europen_europe = (top_10_2016['continent'] =='Europe').sum()print(f"\nTop-10 universities from Europe: {n_europe}")
world_rank                                           university_name        country     continent
         1                        California Institute of Technology  United States North America
         2                                      University of Oxford United Kingdom        Europe
         3                                       Stanford University  United States North America
         4                                   University of Cambridge United Kingdom        Europe
         5                     Massachusetts Institute of Technology  United States North America
         6                                        Harvard University  United States North America
         7                                      Princeton University  United States North America
         8                                   Imperial College London United Kingdom        Europe
         9 ETH Zurich – Swiss Federal Institute of Technology Zurich    Switzerland        Europe
        10                                     University of Chicago  United States North America

Top-10 universities from Europe: 4
Section 6: Grouping & Aggregation
Exercise 11: Aggregate by Continent and Year
# a) Group and aggregatecontinent_year_stats = ( df_merged .groupby(['continent', 'year']) .agg( teaching=('teaching', 'mean'), research=('research', 'mean'), total_score=('total_score', 'mean'), num_students=('num_students', 'sum') ) .reset_index())# b) Filter for 2016 and sortstats_2016 = (continent_year_stats[continent_year_stats['year'] ==2016] .sort_values('total_score', ascending=False))print(stats_2016.to_string(index=False))
    continent  year  teaching  research  total_score  num_students
North America  2016 39.972832 37.064740    67.154286     4142002.0
      Oceania  2016 27.971053 31.160526    62.766667      869584.0
         Asia  2016 28.209406 22.950990    62.526667     4458513.0
       Europe  2016 30.930149 28.067463    59.469524     7728226.0
       Africa  2016 21.421429 17.228571    56.100000      935984.0
South America  2016 26.046154 16.319231          NaN      813732.0
Section 7: Visualization
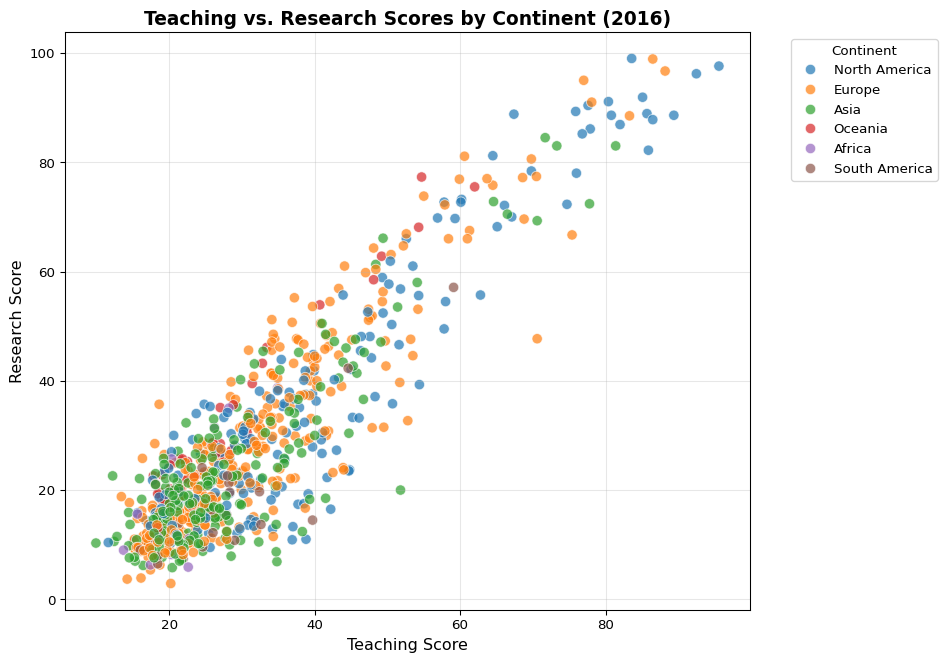
Exercise 12: Scatter Plot — Teaching vs. Research
df_2016 = df_merged[(df_merged['year'] ==2016)].dropna(subset=['teaching', 'research', 'continent'])plt.figure(figsize=(10, 7))sns.scatterplot(data=df_2016, x='teaching', y='research', hue='continent', alpha=0.7, s=60)plt.xlabel('Teaching Score', fontsize=12)plt.ylabel('Research Score', fontsize=12)plt.title('Teaching vs. Research Scores by Continent (2016)', fontsize=14, fontweight='bold')plt.legend(title='Continent', bbox_to_anchor=(1.05, 1), loc='upper left')plt.grid(alpha=0.3)plt.tight_layout()plt.show()
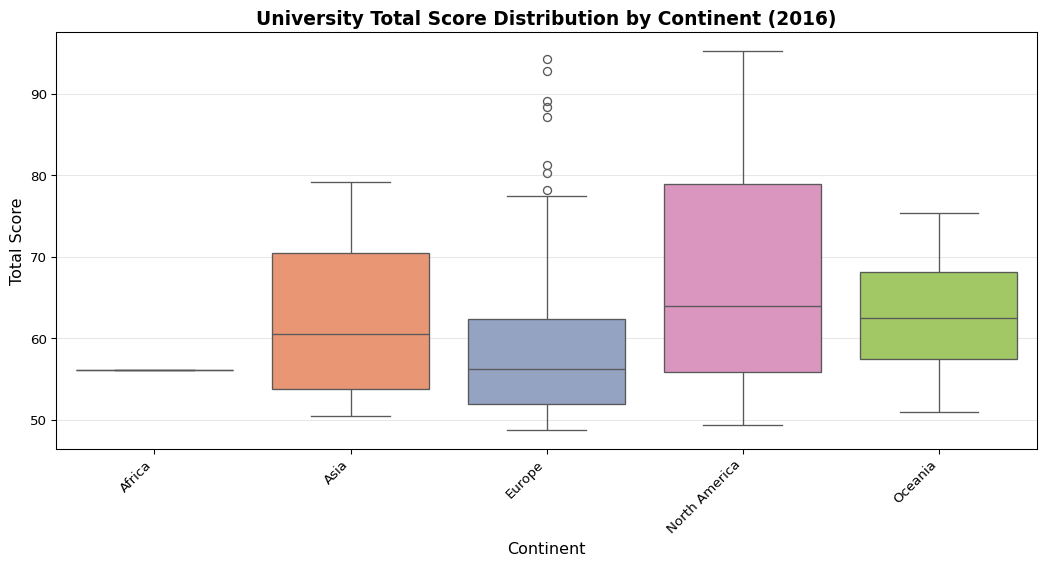
Exercise 13: Box Plot — Score Distribution by Continent
df_box = (df_merged[(df_merged['year'] ==2016)] .dropna(subset=['total_score', 'continent']))plt.figure(figsize=(11, 6))sns.boxplot(data=df_box, x='continent', y='total_score', palette='Set2', order=sorted(df_box['continent'].unique()))plt.title('University Total Score Distribution by Continent (2016)', fontsize=14, fontweight='bold')plt.ylabel('Total Score', fontsize=12)plt.xlabel('Continent', fontsize=12)plt.xticks(rotation=45, ha='right')plt.grid(axis='y', alpha=0.3)plt.tight_layout()plt.show()
/tmp/ipykernel_6783/837324671.py:6: FutureWarning:


Passing `palette` without assigning `hue` is deprecated and will be removed in v0.14.0. Assign the `x` variable to `hue` and set `legend=False` for the same effect.
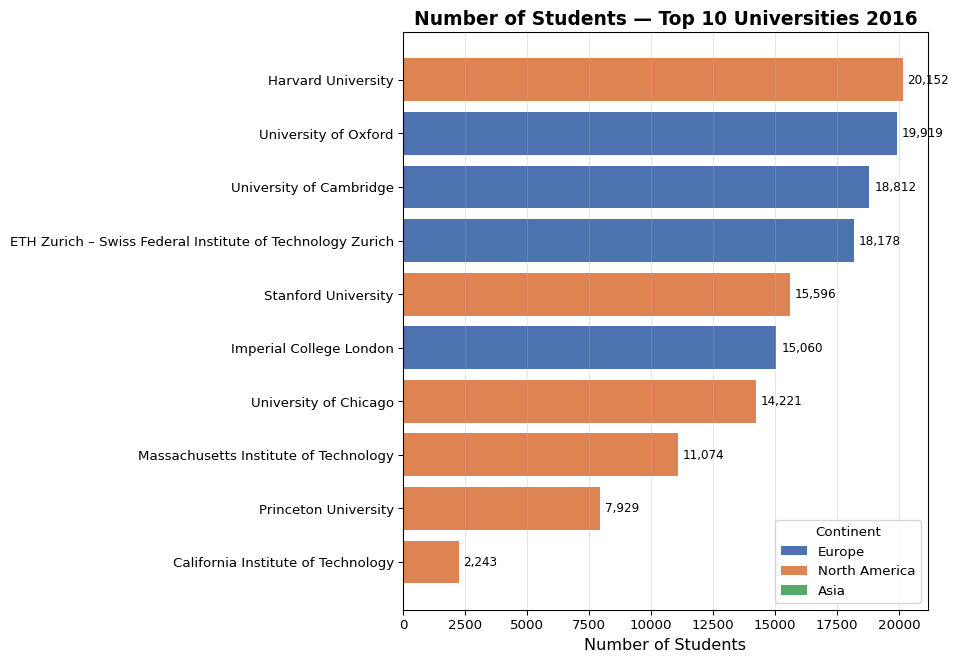
Exercise 14: Bar Chart — Top 10 Universities by Number of Students
top_sorted = top_10_2016.dropna(subset=['num_students']).sort_values('num_students', ascending=True)# Assign colours by continentcontinent_colors = {'Europe': '#4C72B0', 'North America': '#DD8452', 'Asia': '#55A868'}colors = [continent_colors.get(c, '#999999') for c in top_sorted['continent']]plt.figure(figsize=(10, 7))bars = plt.barh(top_sorted['university_name'], top_sorted['num_students'], color=colors)# Annotate with exact countsfor bar in bars: width = bar.get_width() plt.text(width +200, bar.get_y() + bar.get_height() /2,f'{int(width):,}', va='center', fontsize=9)# Legend for continentsfrom matplotlib.patches import Patchlegend_elements = [Patch(facecolor=v, label=k) for k, v in continent_colors.items()]plt.legend(handles=legend_elements, title='Continent', loc='lower right')plt.xlabel('Number of Students', fontsize=12)plt.title('Number of Students — Top 10 Universities 2016', fontsize=14, fontweight='bold')plt.grid(axis='x', alpha=0.3)plt.tight_layout()plt.show()